OVERVIEW
Teammates
Eric M., Gwen C., Jimmy P. & Nadeen S.
Partners
University of Virginia Darden Business School and DT:DC Summer of Design
Project Length
12 Weeks
Blueprint: Personalizing Tax Plans for Women Small Business Owners
I completed this project as part of my course work for the University of Virginia’s Darden School of Business Design Thinking and Innovation Specialization. We were challenged with the question: How might we improve the tax-payer experience for Women small business owners? After weeks of research, synthesis, and ideation, we pitched our final idea, Blueprint, to a panel of judges, including a representative from the IRS. My team was awarded third place.
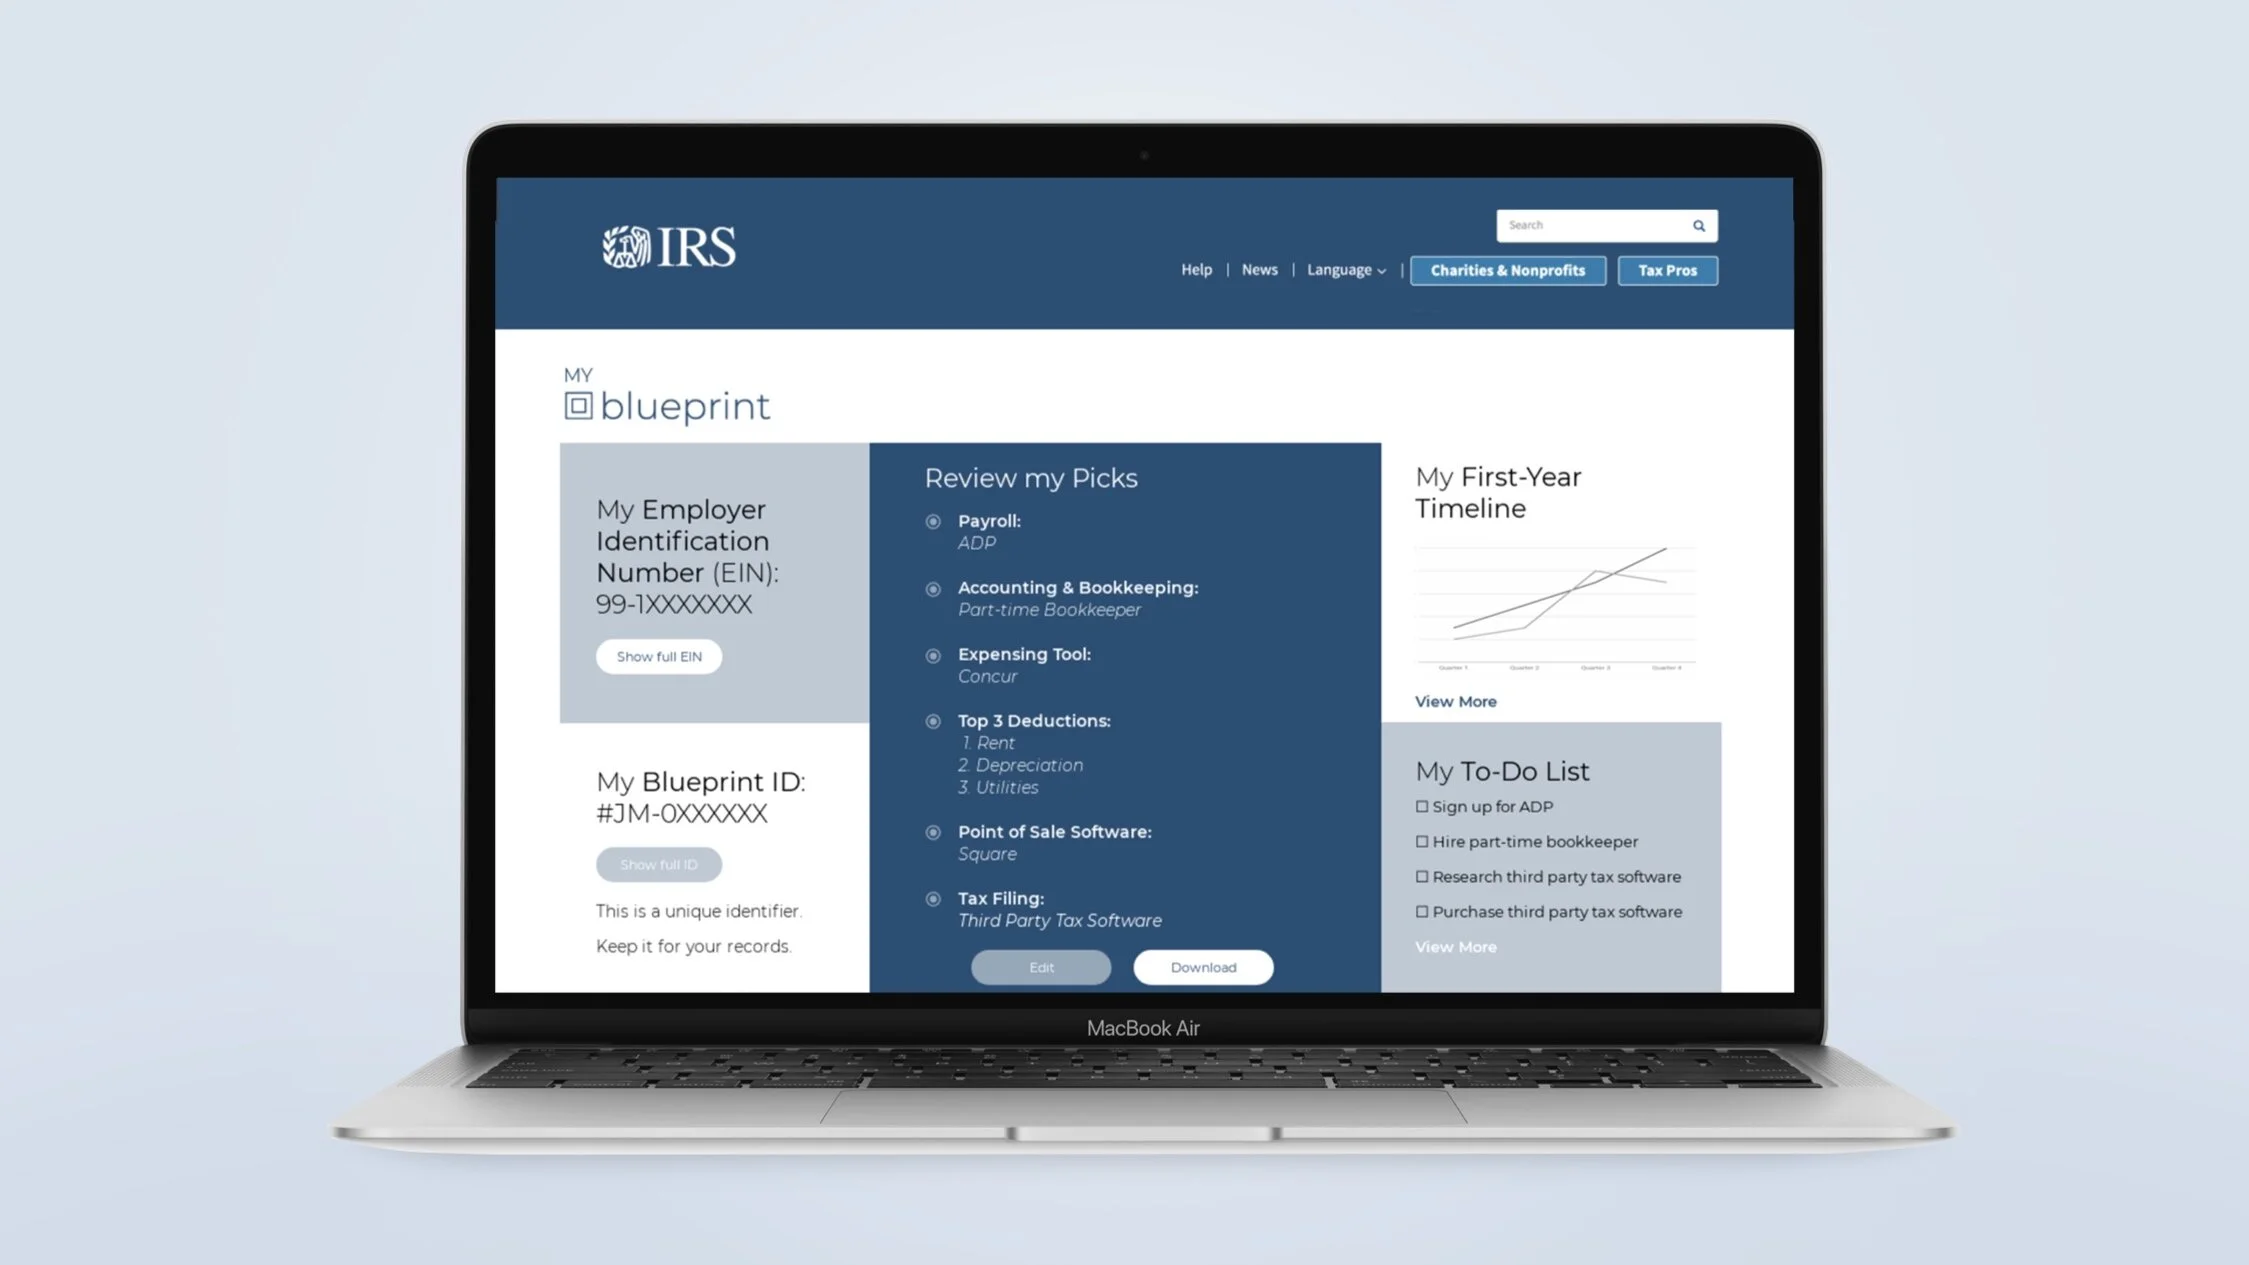
The Idea: Blueprint is a service that empowers new small business owners to establish a personalized tax plan when they register for an EIN (Employer Identification Number) through the IRS. After opting-in, a small business owner completes a short survey, identifying key business information and criteria around taxes. Based on the information provided, the owner is presented options of recommended approaches, which she chooses from to create a tax plan based on her unique needs. By equipping new small business owners with a tax plan early on, we believe that Blueprint will increase tax-paying confidence, reduce stress, and empower women to make informed decisions when first starting out.
The Process
INSPIRATION & SYNTHESIS
We began the project by engaging with our project’s experts-- the women small business owners (who we gave the acronym WSBOs) of the DC area. Over three weeks, my team conducted 16 in-person and remote interviews with WSBOs and financial experts to learn about their tax experience and the extent to which gender impacted their experience.
Since we didn’t have a ton of time, we had to get scrappy. We reached out to a number of local women-owned businesses and attempted to capture a range of business types, size and length of time in business, and particularly focused on their experience with paying taxes. From the range of women we spoke with and observed, we quickly learned how unique the tax-payer experience is.
After our first three weeks dedicated to research, we took our data and worked to synthesize what we heard (something we continued to revisit until the very end of our project). We created key personas, initial journey maps, and created affinity maps to group our findings.
My team and I spent many hours creating affinity maps and re-arranging them until we were confident in our groupings. From there, we developed our key insights and design criteria. We ultimately landed on:
Insight 1
Women SBOs react negatively to being perceived as less capable than men at completing their civic duty of paying taxes because it suggests that they are less adept than men.
Insight 2
When a new business owner struggles to correctly file taxes, she is challenged in her belief that she can run an effective business because successful tax filing is inextricably linked to successful business operations.
Insight 3
New women business owners go to less-credible sources for preliminary tax research because they are easily accessible, readily available, and non-judgmental.
Design Criteria 1
Our solution will be solution oriented rather than gender focused.
Design Criteria 2
Our solution will empower women to successfully complete their taxes and will validate their competency as business women.
Design Criteria 3
Our solution will foster a tax-paying experience that is accessible, available, and non-judgmental.
IDEATION
Around week eight we began to ideate, using our insights and design criteria as guides. We came up with many out of the box ideas, mostly in the form of quick napkin pitches (see examples below). A few team favorites that ended up getting slashed included the “Tax Monster” and the “Tax Lottery.” We took glimmers of promise from many different ideas to come up with the idea we decided to build out, a digital service that would allow users to create a clear plan in the beginning around taxes.
While I’m presenting these insights and ideation “phases” linearly, for simplicity, this process was far from linear for my team. There were many times we scrapped our idea to return back to our affinity mapping to further distill and strengthen our insights.
THE IDEA
Rather than making something specifically targeted to women, which we had learned that women didn’t want, our idea was to help new business owners create a plan from the beginning, since we heard from many that the first few years of the tax journey was often the hardest. As a result, we started at the first touchpoint with the IRS, establishing an EIN, as our place of intervention. By helping women create a plan, we could provide them with credible information from a trusted source (the IRS) while still empowering them to be in charge of their own tax-journey.
DESIGN & FEEDBACK
Once agreeing on our general idea, we began to sketch, then wireframe out our idea to nail down details and get feedback. We shared early wireframes with 10 WSBOs to get initial feedback and impressions. Of the ten women we spoke with, eight said they would opt into using Blueprint. From these conversations we also gained insight into concerns that they may have including privacy concerns, the process feeling “spamy,” and a potential for lack of interest. By speaking with WSBOs early in the design process, we were able to add and adjust our design approach to address concerns.
